LA Citation Analysis
Analyzing 20M+ LA Parking Citations (2014–2025)
By Anthony Govoni
Overview
This analysis explores over 20 million parking citation records issued in Los Angeles from 2014 to 2025 to uncover patterns in time, location, vehicle characteristics, and violation types. By leveraging spatial, temporal, and categorical data, the study identifies enforcement trends, geographic hotspots, and revenue drivers.
1. ETL Process
1.1 Extract
- Retrieved parking citation datasets from Data.gov
- Collected U.S. ZIP code shapefile data for geographic mapping
1.2 Transform
- Cleaned raw data in Python:
- Standardized timestamp formats
- Removed irrelevant columns
- Filtered out records with missing or invalid value
- Enriched spatial context:
- Used ZIP code shapefiles to map latitude/longitude coordinates
- Mapped each record to its corresponding neighborhood
- Assembled a clean, location-aware dataset for analysis
1.3 Load
- Uploaded the final dataset to an Amazon S3 bucket
- Connected data to Amazon QuickSight for dynamic visualizations and insights
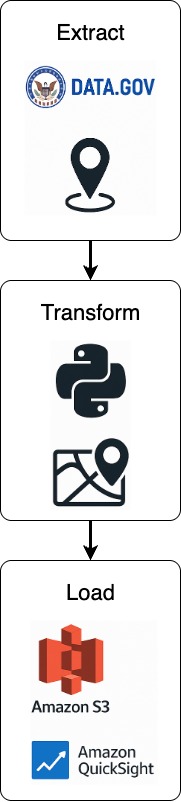
Figure 1: Total Citation Amount per Year
1. Pre-Pandemic Peak and Decline (2014–2019)
- Citation revenue was relatively stable from 2014 to 2019, hovering between $149M and $161M.
2. Pandemic Impact (2020–2021)
- Sharp drop in 2020 to $112M, a 25.8% decrease from 2019.
- Recovery in 2021 to $127M, but still well below pre-pandemic levels.
- Likely linked to:
- Fewer cars on the road during lockdowns
- Suspension of some parking enforcement policies
3. Post-Pandemic Recovery (2022–2024)
- Steady climb from $127M in 2021 to $145M in 2022, then a dip to $135M in 2023.
- $142M in 2024 indicates enforcement and mobility levels are nearly back to pre-pandemic norms.
4. Partial 2025 Projection
- $83M as of June 2025 suggests a potential year-end total of ~$166M if trends hold — possibly the highest in the dataset.
Figure 2: Total Citations by Neighborhood
1. Downtown Dominates by Volume
- Downtown LA issued over 2.18 million citations, far exceeding the next-highest (Brookside, 1.61M).
- Indicates intense parking regulation and/or demand — high density, commercial/commute zones.
2. Volume ≠ Highest Revenue per Citation
- Neighborhoods like Panorama City ($88), Pasadena ($102), and Huntington Park ($103) have high average citations, despite lower volumes.
- This may indicate stricter violations, premium parking areas, or more special enforcement zones.
3. Outliers with Extreme Citation Amounts
- Agoura Hills averages $221 with only 3 citations. Pico Rivera at $137 with 38 citations. These may be anomalies or data entry errors, or they could reflect rare high-tier violations.
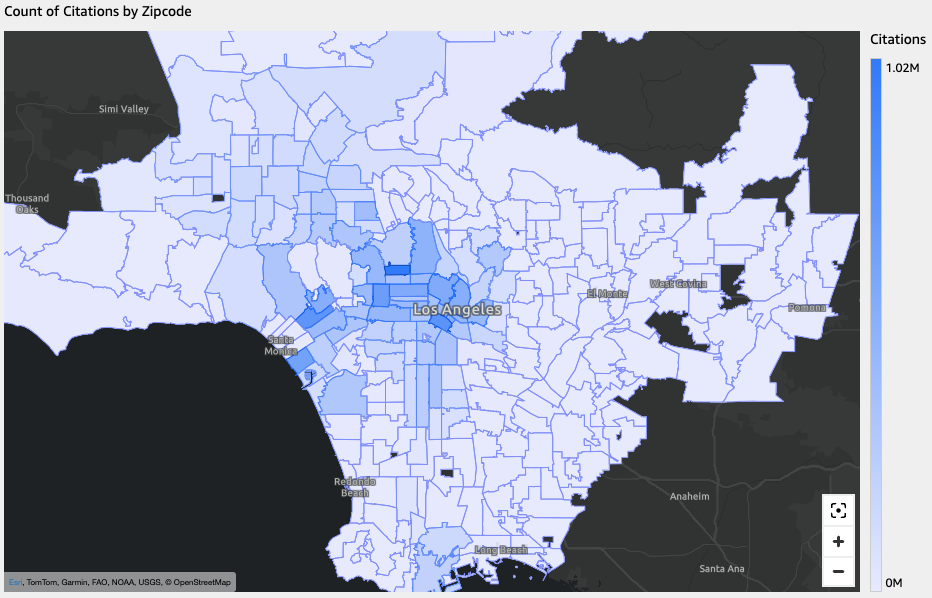
Figure 3: Count of Citations by Zipcode
Hightlights
- Downtown & Central LA ZIP codes are clear citation hotspots.
- Mid-Wilshire, Hollywood, and Koreatown show moderately high citation density.
- Peripheral areas like Thousand Oaks, Pasadena, and Pomona have far fewer citations, possibly due to different municipal enforcement practices or less vehicular congestion.
- Coastal areas like Santa Monica and Redondo Beach show some concentration but not to the level of the city core.